
7 Champions League Draw Mistakes Fans Make in 2026
Champions League draw predictions are not random guesses: they combine UEFA’s 36-team league-phase format, pot strength, home-and-away balance, travel demands, squad quality and schedule timing. In 20...
7 Champions League Draw Mistakes Fans Make in 2026
Champions League draw predictions are not random guesses: they combine UEFA’s 36-team league-phase format, pot strength, home-and-away balance, travel demands, squad quality and schedule timing. In 2026, each club receives eight different opponents, with two opponents from each of four pots and one home and one away fixture against every pot category. Paris Saint-Germain, Real Madrid, Manchester City, Liverpool, Arsenal, Barcelona and Bayern Munich therefore cannot be judged solely by reputation or a single headline pairing. The official 2026/27 draw is scheduled for 27 August 2026 in Monaco, with Matchday 1 planned for 8–10 September 2026. World Cup Hub uses draw structure, recent form, tactical matchups and market movement to build more disciplined forecasts for international football followers. The practical takeaway is simple: rate the complete eight-match schedule, not merely the most glamorous opponent.
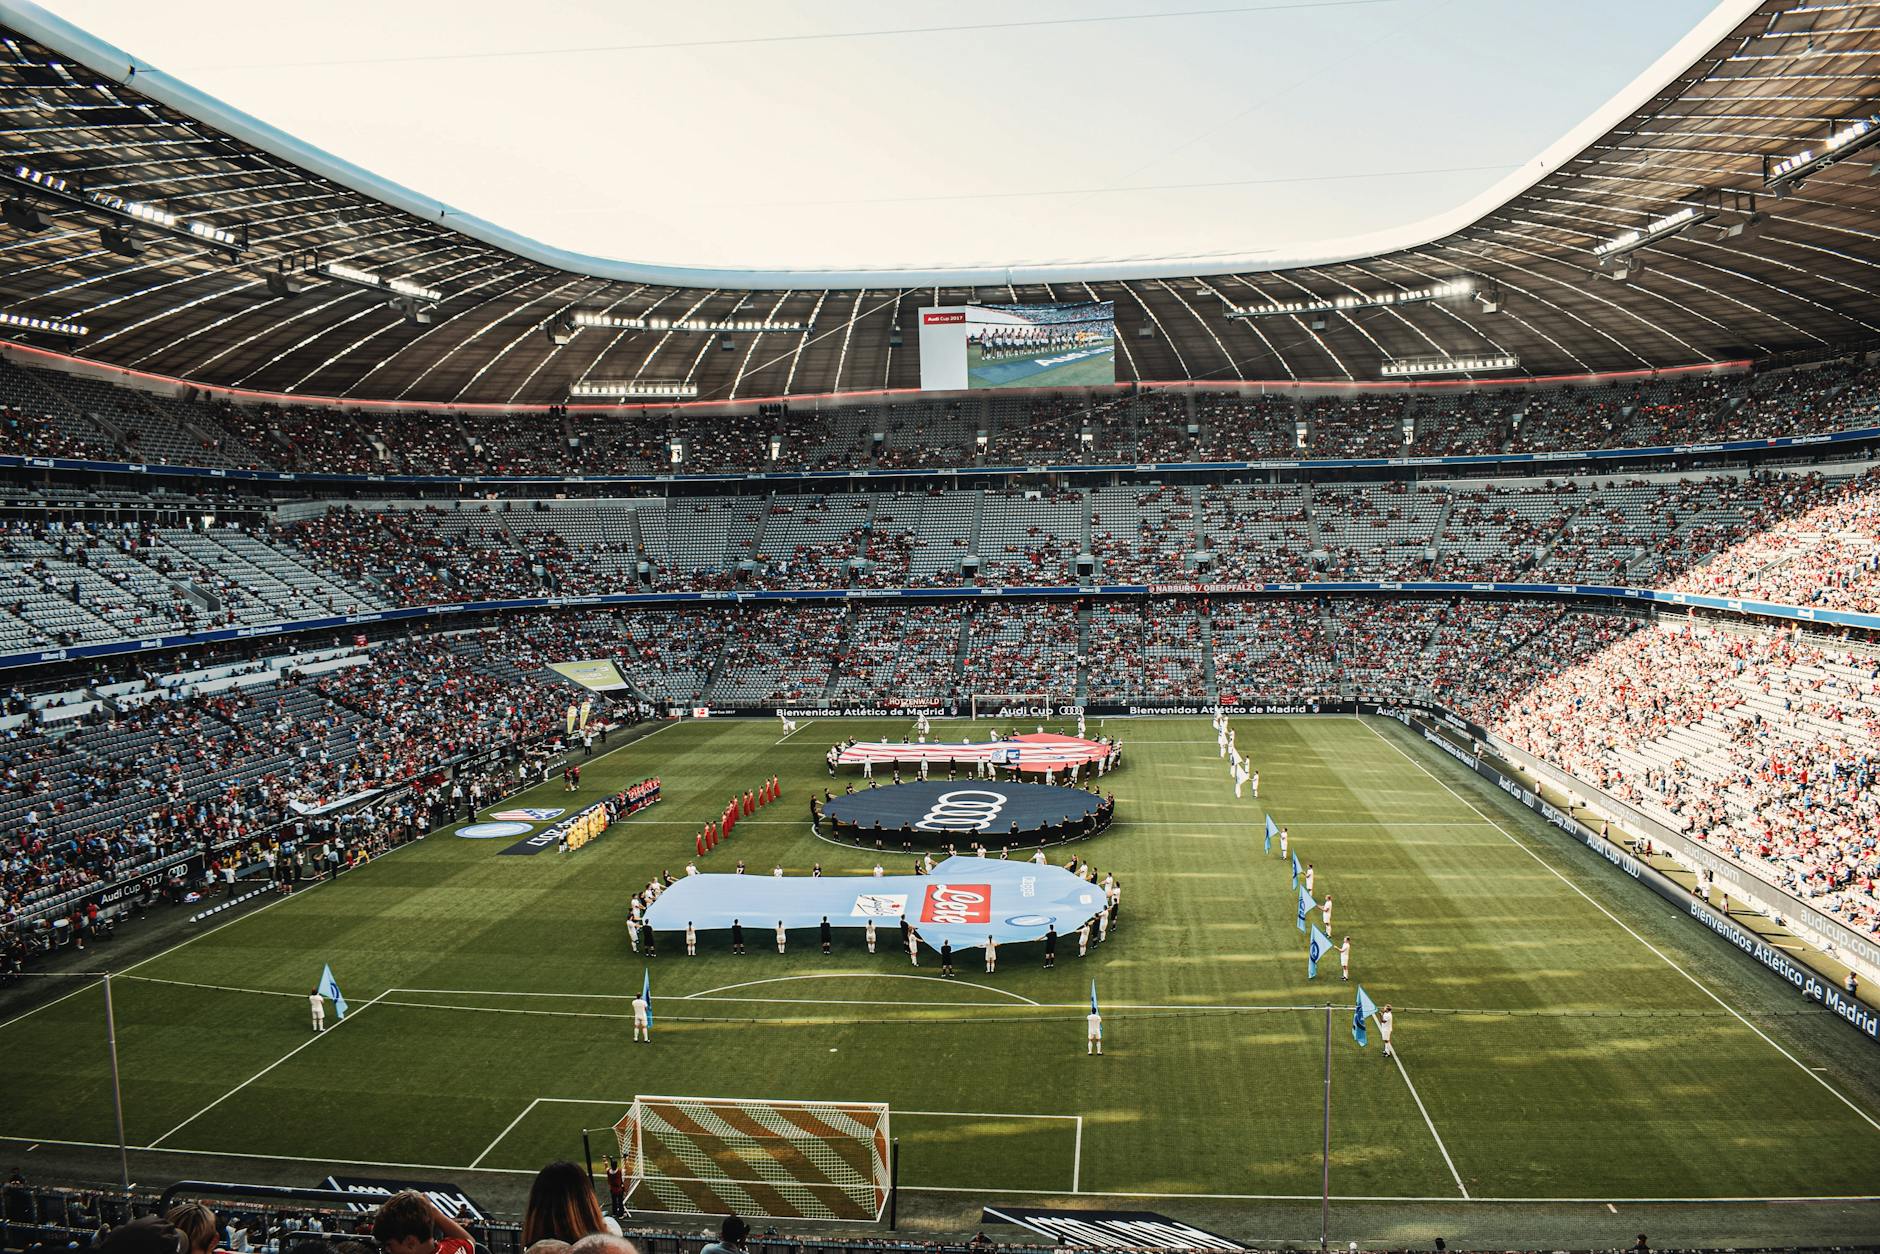
Photo by David Michael Bayliss on Pexels
Want a more structured way to assess football markets and tournament data?
Myth 1: “The toughest single opponent decides the whole draw” — debunked
The strongest Champions League draw prediction must evaluate all eight fixtures, because one difficult match is often less important than the combined difficulty of the schedule. A club facing Real Madrid away may still have a favourable route if its remaining seven fixtures include manageable home games and limited travel. Conversely, a team avoiding every superclub can still struggle when it draws three awkward away trips, two tactically uncomfortable mid-tier opponents and a congested domestic calendar. UEFA’s league phase rewards consistency across eight matches rather than the old six-game group-stage rhythm.
A useful model separates schedule difficulty into four components: opponent rating, venue, travel burden and rest availability. For example, a hypothetical Arsenal schedule containing Paris Saint-Germain and Inter Milan at home may be less dangerous than a schedule containing Borussia Dortmund away, Galatasaray away and a long trip to Bodø/Glimt, even if the second list looks less impressive on television. UEFA’s official competition regulations explain the league-phase structure and the ranking pathway from positions 1–8, 9–24 and 25–36; those positions matter because the top eight qualify directly for the round of 16, while teams ranked 9th to 24th enter knockout play-offs. UEFA Champions League remains the primary reference point for format confirmation.
My own stubborn rule is that I never grade a draw by the biggest badge on the page. I once backed a famous club because it avoided the obvious giant and watched it get strangled by three away fixtures instead. That was an expensive education, but at least the lesson came with ninety minutes of football and not a university bill.
- Rate all eight opponents, not one headline fixture.
- Separate home strength from away strength.
- Add travel distance and rest days to the difficulty calculation.
- Recheck the forecast after the full fixture calendar is published.
Myth 2: “Pot 1 teams automatically receive easy schedules” — partially true
Pot 1 status improves a club’s baseline expectation, but it does not guarantee an easy league phase. Pot placement reflects UEFA’s access list and club coefficient structure, while current performance depends on managerial changes, injuries, tactical evolution and domestic workload. A top-seeded club can still meet elite opponents from other pots, and every team receives two opponents from each pot under the 2026/27 format.
The practical advantage of Pot 1 is not immunity; it is probability. A club such as Bayern Munich or Real Madrid generally starts with superior squad depth and a stronger European record, but those advantages can be diluted by a difficult away sequence. A team like Manchester City may dominate possession against weaker opponents yet become vulnerable when its midfield rotation is disrupted by travel and short recovery periods. Likewise, Barcelona’s technical quality does not eliminate the risk of losing points against aggressive pressing sides such as Paris Saint-Germain or physically intense teams from Türkiye.
For prediction purposes, I assign a starting strength score, then adjust it for venue and absences. A simple example uses a 100-point team rating: 75 points for squad and performance quality, 15 for home advantage, and 10 for schedule conditions. That is not a sacred formula; no formula survives a deflected cross. It is simply better than treating every Pot 1 badge as a guaranteed winner.
To understand how coefficients influence European seeding, consult UEFA club coefficients, then compare those historical numbers with current expected-goals data rather than relying on reputation alone.
Myth 3: “A draw simulator is the same as a prediction” — flat-out false
A Champions League draw simulator produces a legally possible fixture set; it does not forecast which set UEFA will draw or how clubs will perform afterward. The distinction is important because a simulator can model pot restrictions, country protection and home-away allocation, but it cannot know whether a starting striker will miss Matchday 2 or whether a new coach will change a team’s pressing system. A generated schedule is a scenario, not evidence of likely results.
The best simulators are still valuable when used for probability testing. Run at least 1,000 simulations, record how often each club receives two or more high-rated opponents, and measure average travel exposure across the sample. For instance, if Manchester United receives an average of 2.4 top-tier opponents across repeated valid simulations, a single simulated draw containing four elite clubs should not be treated as normal. This method also reveals edge cases that casual predictions miss: a club can have a moderate opponent average but an unusually harsh away schedule.
World Cup Hub recommends saving the simulator assumptions, including team ratings, pot assignments and restrictions. Otherwise, you cannot reproduce the result when UEFA changes a qualified club or updates the access list. A quote from UEFA’s competition framework captures the principle: “The league phase consists of 36 clubs.” That number is not decoration; it determines the whole probability space.

Photo by Manh Pham on Pexels
See how scenario testing can improve your pre-match research before placing any wager.
What actually works: a data-led Champions League draw method
The most reliable process combines structural information with football context. Begin with the confirmed 36-team field and four pots, then create a fixture matrix showing each club’s two opponents from every pot, venue, travel route and rest interval. Next, compare squad ratings with recent performance indicators such as expected goals, shot quality, possession under pressure and set-piece efficiency. Finally, translate the schedule into likely league-phase finishing ranges rather than pretending to know an exact final position.
Use this five-step workflow:
- Confirm the format: verify the 36 clubs, four pots and eight opponents through UEFA.
- Grade opponent quality: use current metrics alongside UEFA coefficient history.
- Adjust for venue: apply a measurable home advantage instead of a vague “home crowd” boost.
- Check logistics: identify long travel, altitude, weather and short-rest combinations.
- Build ranges: estimate top-eight, play-off and elimination probabilities.
One information edge deserves more attention: fixture order can matter more than total opponent strength. A club meeting two elite opponents in September, before its new squad has settled, faces a different risk from a club meeting those opponents in November after tactical automatisms improve. Another overlooked edge is travel clustering; two distant away fixtures separated by only a few days can affect domestic performance even when the European matches themselves are winnable.
My preferred output is a probability table, not a dramatic sentence. For example: 42% top eight, 48% positions 9–24, and 10% elimination after the league phase. Those percentages are estimates, not a promise from the football gods, who have ignored my spreadsheets for decades.
[Internal Link: Champions League league-phase format guide]
How should betting markets be compared with draw predictions?
Betting markets should be treated as a price to evaluate, not as proof that a prediction is correct. Compare your estimated probability with the implied probability after accounting for bookmaker margin, then check whether the market reflects confirmed injuries, lineup rotation and fixture congestion. A forecast has potential value only when your estimated chance is materially higher than the market’s implied chance.
For example, decimal odds of 2.50 imply a raw probability of 40%, before margin and other market factors. If your model estimates a 46% chance, the apparent edge is six percentage points, but that advantage may disappear if your model ignores an away venue or a suspended defensive midfielder. Markets also move quickly after the official draw, so early prices may reflect incomplete information while later prices may reflect sharper team news.
The responsible approach is to record the original odds, your assumptions and the closing price. Never increase a stake simply because a favourite has a famous shirt or because a previous selection lost. The UK Gambling Commission’s responsible gambling guidance emphasises informed decision-making and controlled participation. If betting stops being entertainment and becomes financial pressure, stop and seek support; no Champions League prediction is worth borrowing money for.
For deeper evaluation, use World Cup Hub’s match prediction coverage as a research starting point, while checking official team news independently.
What should serious analysts ignore before the official draw?
Serious analysts should ignore unverified social-media leaks, recycled odds screenshots, unsupported “easy draw” claims and predictions based solely on last season’s reputation. A club’s 2025 European run may provide context, but it cannot replace 2026 squad availability, coaching changes or the confirmed league-phase schedule. Similarly, one friendly result offers almost no dependable evidence about competitive Champions League performance.
Ignore false precision as well. Predicting that Liverpool will finish exactly fifth before the fixture list exists is theatre wearing a spreadsheet costume. Use ranges, confidence levels and scenario notes instead. The most useful forecast might state that Liverpool has a 55% chance of finishing in the top eight, but that probability falls if two away fixtures occur within a four-day domestic window.
Watch for these warning signs:
- A prediction cites no venue or fixture order.
- A simulator result is presented as an official UEFA draw.
- Historical coefficient data is used without current-form adjustments.
- A tip omits bookmaker margin and available odds.
- The writer guarantees a result or encourages reckless staking.

Photo by Soccer Trippers on Pexels
Want to separate useful draw analysis from noisy football commentary?
How can World Cup Hub improve Champions League draw predictions?
World Cup Hub can make Champions League draw predictions more useful by treating them as a living model rather than a one-day article. The first version should appear after the 27 August 2026 draw, then update when UEFA confirms fixture dates, clubs publish injury reports and bookmakers adjust outright markets. This matters because an eight-match schedule is not static in practical terms: kickoff timing, travel, rotation and domestic matches change the risk profile.
A strong World Cup Hub page should publish three layers of information. The first is a transparent draw summary listing all eight opponents and venues. The second is a tactical comparison explaining why a high-possession team may struggle against a transition-focused opponent. The third is a probability dashboard showing top-eight qualification, play-off survival and league-phase elimination. Readers can then distinguish factual draw data from analytical judgment.
A useful contrarian conclusion follows from that structure: the best outright winner prediction may not belong to the club with the easiest draw. A manageable schedule can improve qualification odds while doing little for knockout-round superiority, where elite opponents, two-leg tactics and injury timing dominate. Therefore, separate “to finish top eight” from “to win the Champions League”; combining them creates lazy analysis and, believe it or not — I do know lazy analysis when I see it.
[Internal Link: advanced football betting probability methods]
Conclusion: predict the schedule, not the story
Champions League draw predictions become sharper when they measure the complete league phase instead of chasing the loudest matchup. In 2026, the 36-team structure, four-pot allocation, eight opponents, home-away balance, travel and fixture order all influence qualification probabilities. Use UEFA for official information, simulators for scenario testing, current performance data for team strength and responsible staking rules for financial control. World Cup Hub’s role is to connect those ingredients into practical daily analysis for football followers, but every forecast should remain conditional because injuries, tactics and fixture congestion can overturn a beautiful model in ten chaotic minutes.
The sensible final checklist is straightforward:
- Confirm the official 2026/27 draw date and 36-team field.
- List all eight opponents and venues.
- Recalculate after fixture dates and team news.
- Compare probability with market-implied price.
- Set a fixed budget and never chase losses.
Ready to review the latest football analysis and tournament insights?
Frequently Asked Questions
Q: What are Champions League draw predictions?
A: Champions League draw predictions estimate how difficult a club’s league-phase schedule may be and how likely it is to reach a specific finishing range. The analysis normally considers UEFA pots, opponent ratings, home and away venues, travel, fixture order and squad availability. In the 2026/27 format, every club plays eight different opponents, making complete-schedule analysis more important than judging one famous pairing.
Q: How do you make Champions League draw predictions?
A: Start by confirming the official 36-team field, pot allocation and UEFA restrictions, then grade each club’s eight opponents. Add venue strength, travel distance, rest days, injuries, tactical matchups and recent performance data before estimating top-eight, play-off or elimination probabilities. Recalculate the forecast after UEFA publishes exact fixture dates because schedule order can materially change the outcome.
Q: What is the difference between a draw simulator and a Champions League prediction?
A: A draw simulator generates legally possible fixture combinations, while a prediction estimates likely results or finishing positions. A simulator can model pots, country restrictions and home-away rules, but it cannot accurately forecast injuries, coaching changes or match outcomes. Running 1,000 or more simulations is useful for probability ranges, but one generated draw is not an official UEFA result.
Q: Are Pot 1 teams guaranteed an easy Champions League draw?
A: No, Pot 1 teams receive a seeding advantage but are not guaranteed an easy schedule. Under the 2026/27 league-phase structure, each club still faces two opponents from every pot, including difficult teams from Pots 2, 3 and 4. A strong seed can also suffer from several challenging away fixtures, short recovery periods or poor fixture order.
Q: Why do Champions League draw predictions fail?
A: Predictions usually fail because they rely on reputation, ignore fixture order or treat historical UEFA coefficients as current team strength. Unconfirmed injuries, managerial changes and domestic congestion can also invalidate an early forecast. To reduce error, record assumptions, use probability ranges, confirm team news and update the model after the official schedule is released.
Q: How much does it cost to use a Champions League draw simulator?
A: Many basic Champions League draw simulators are free, although advanced statistical tools may require a subscription or paid data provider. Before paying, check whether the tool supports the 36-team league phase, four-pot allocation, country restrictions and home-away distribution. Free tools are adequate for scenario testing, but professional analysis may add historical databases, expected-goals feeds and automated fixture updates.
Q: Is it safe to bet on Champions League draw predictions?
A: Betting on Champions League predictions carries financial risk, so it is safest only with a fixed entertainment budget and no loss-chasing. Compare your estimated probability with the odds, account for bookmaker margin and avoid wagers based solely on a club’s name. Use licensed operators in your jurisdiction, follow local rules and stop if betting creates financial or emotional pressure.
Thank you for reading.
For those who play for more than just the thrill.
World Cup Hub · The High-Stakes Editorial · No. 01